Medicare Hospital SQL Analysis
A 28-query descriptive PostgreSQL analysis of 6,000+ Medicare-registered U.S. hospitals, covering hospital distribution, quality ratings, ownership, and reported emergency services in a five-dashboard Tableau story.
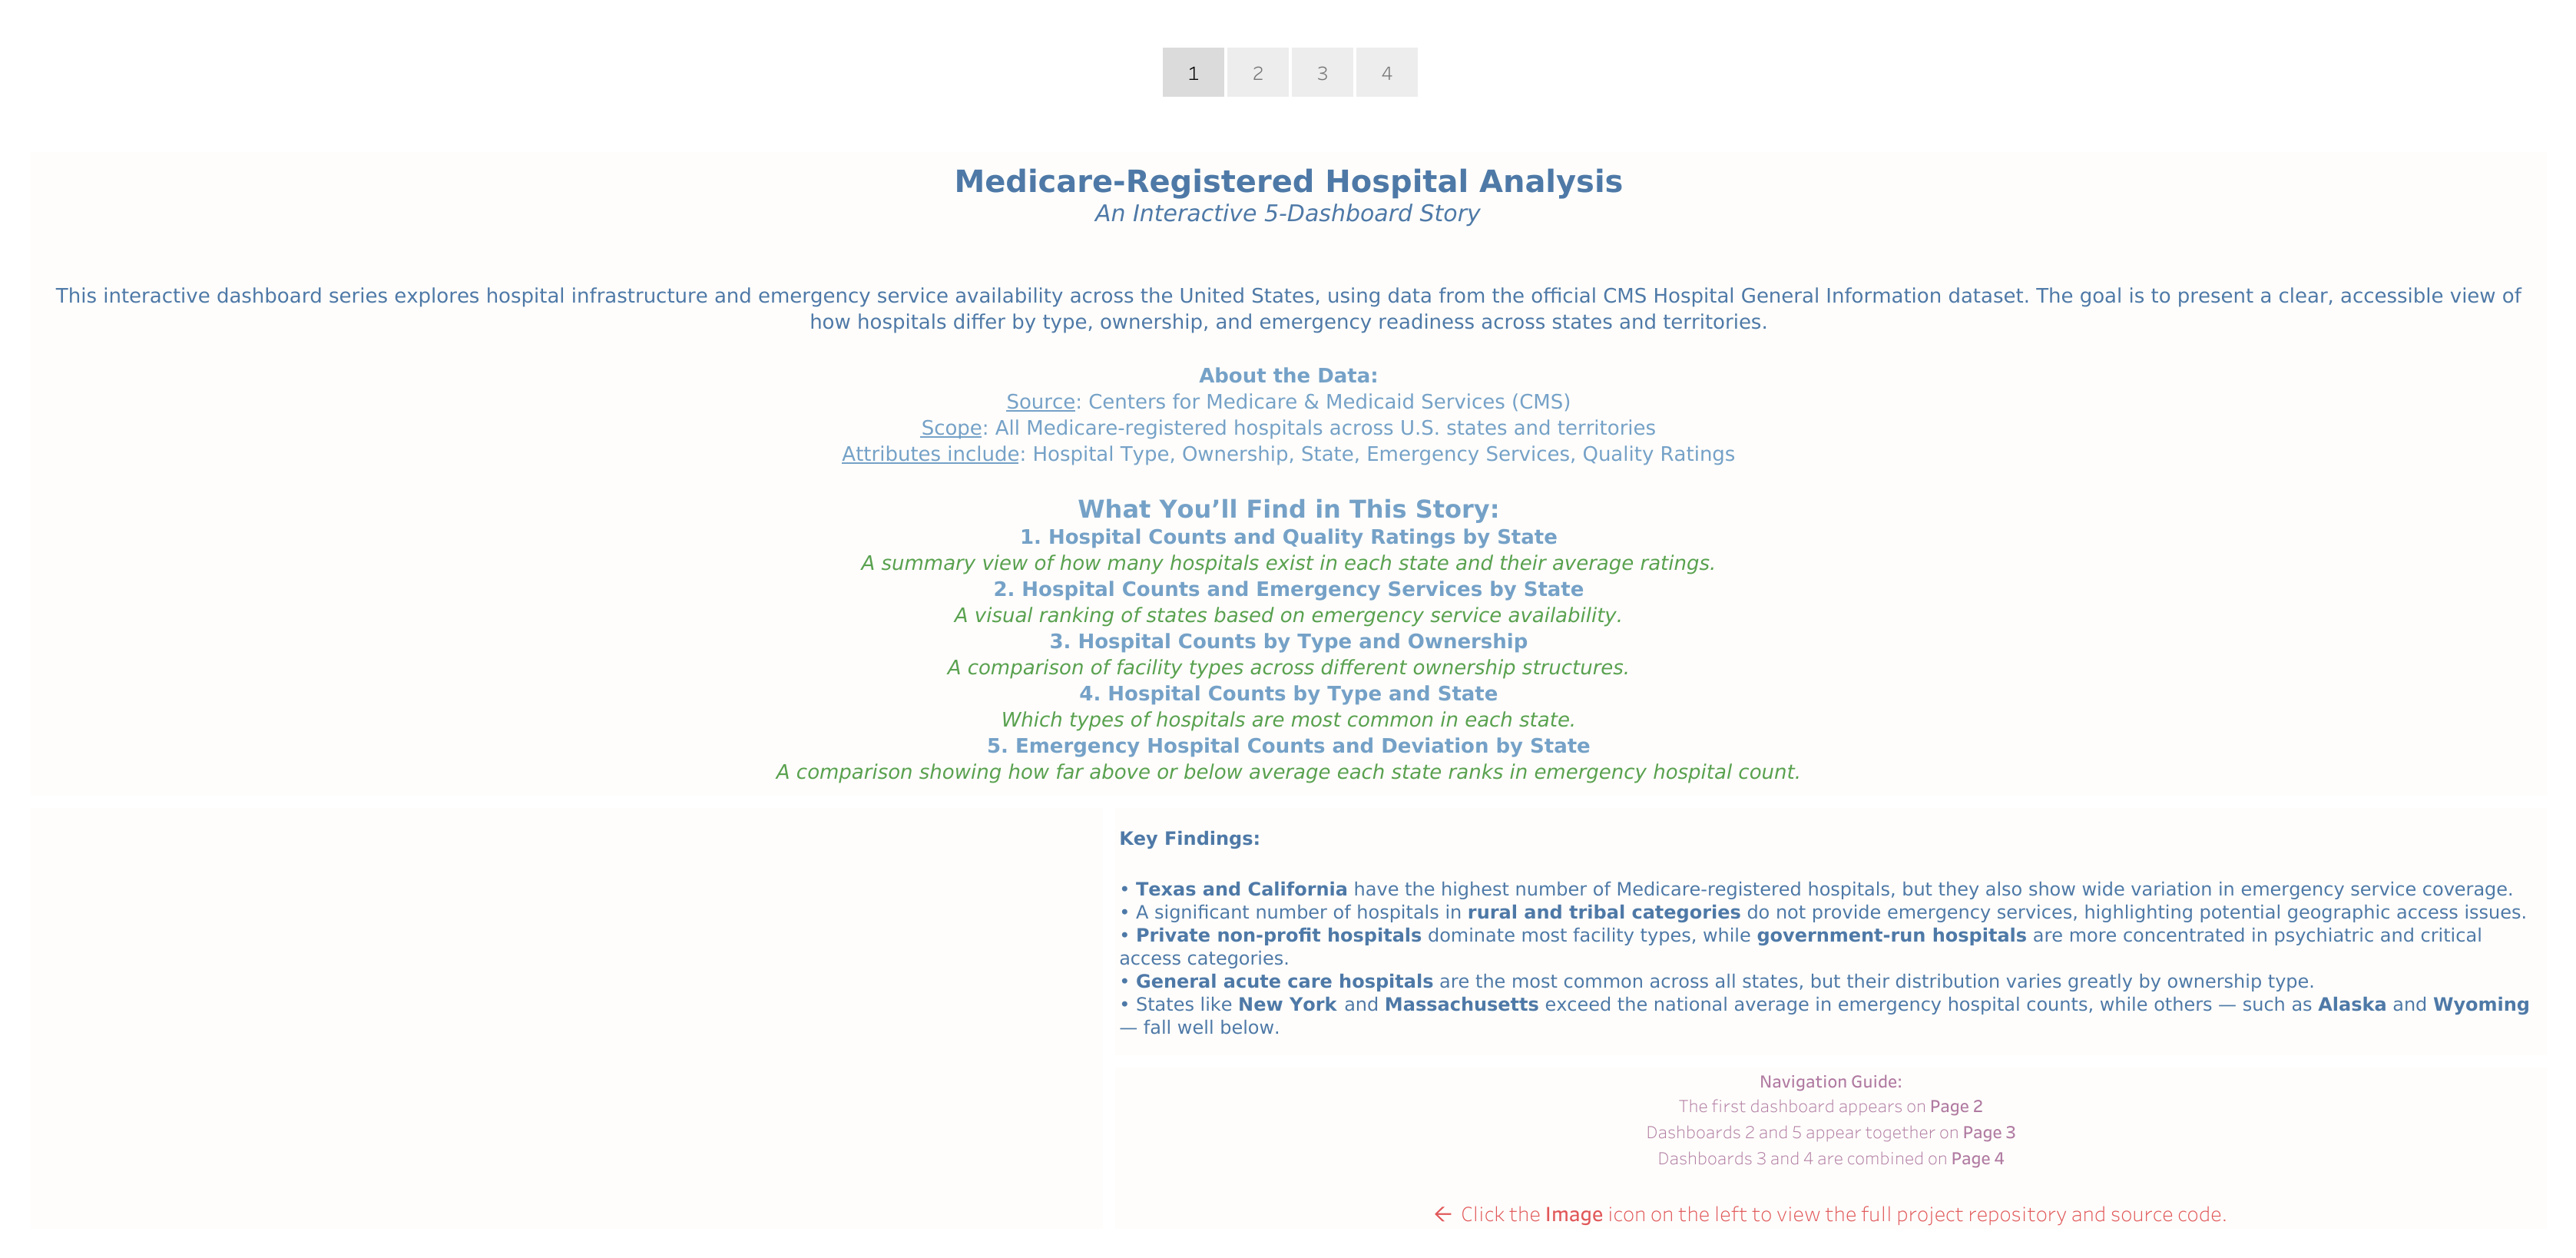
The CMS Hospital General Information dataset contains thousands of facility records in a flat-file format. The project uses SQL to turn that snapshot into reviewable summaries and dashboard-ready tables.
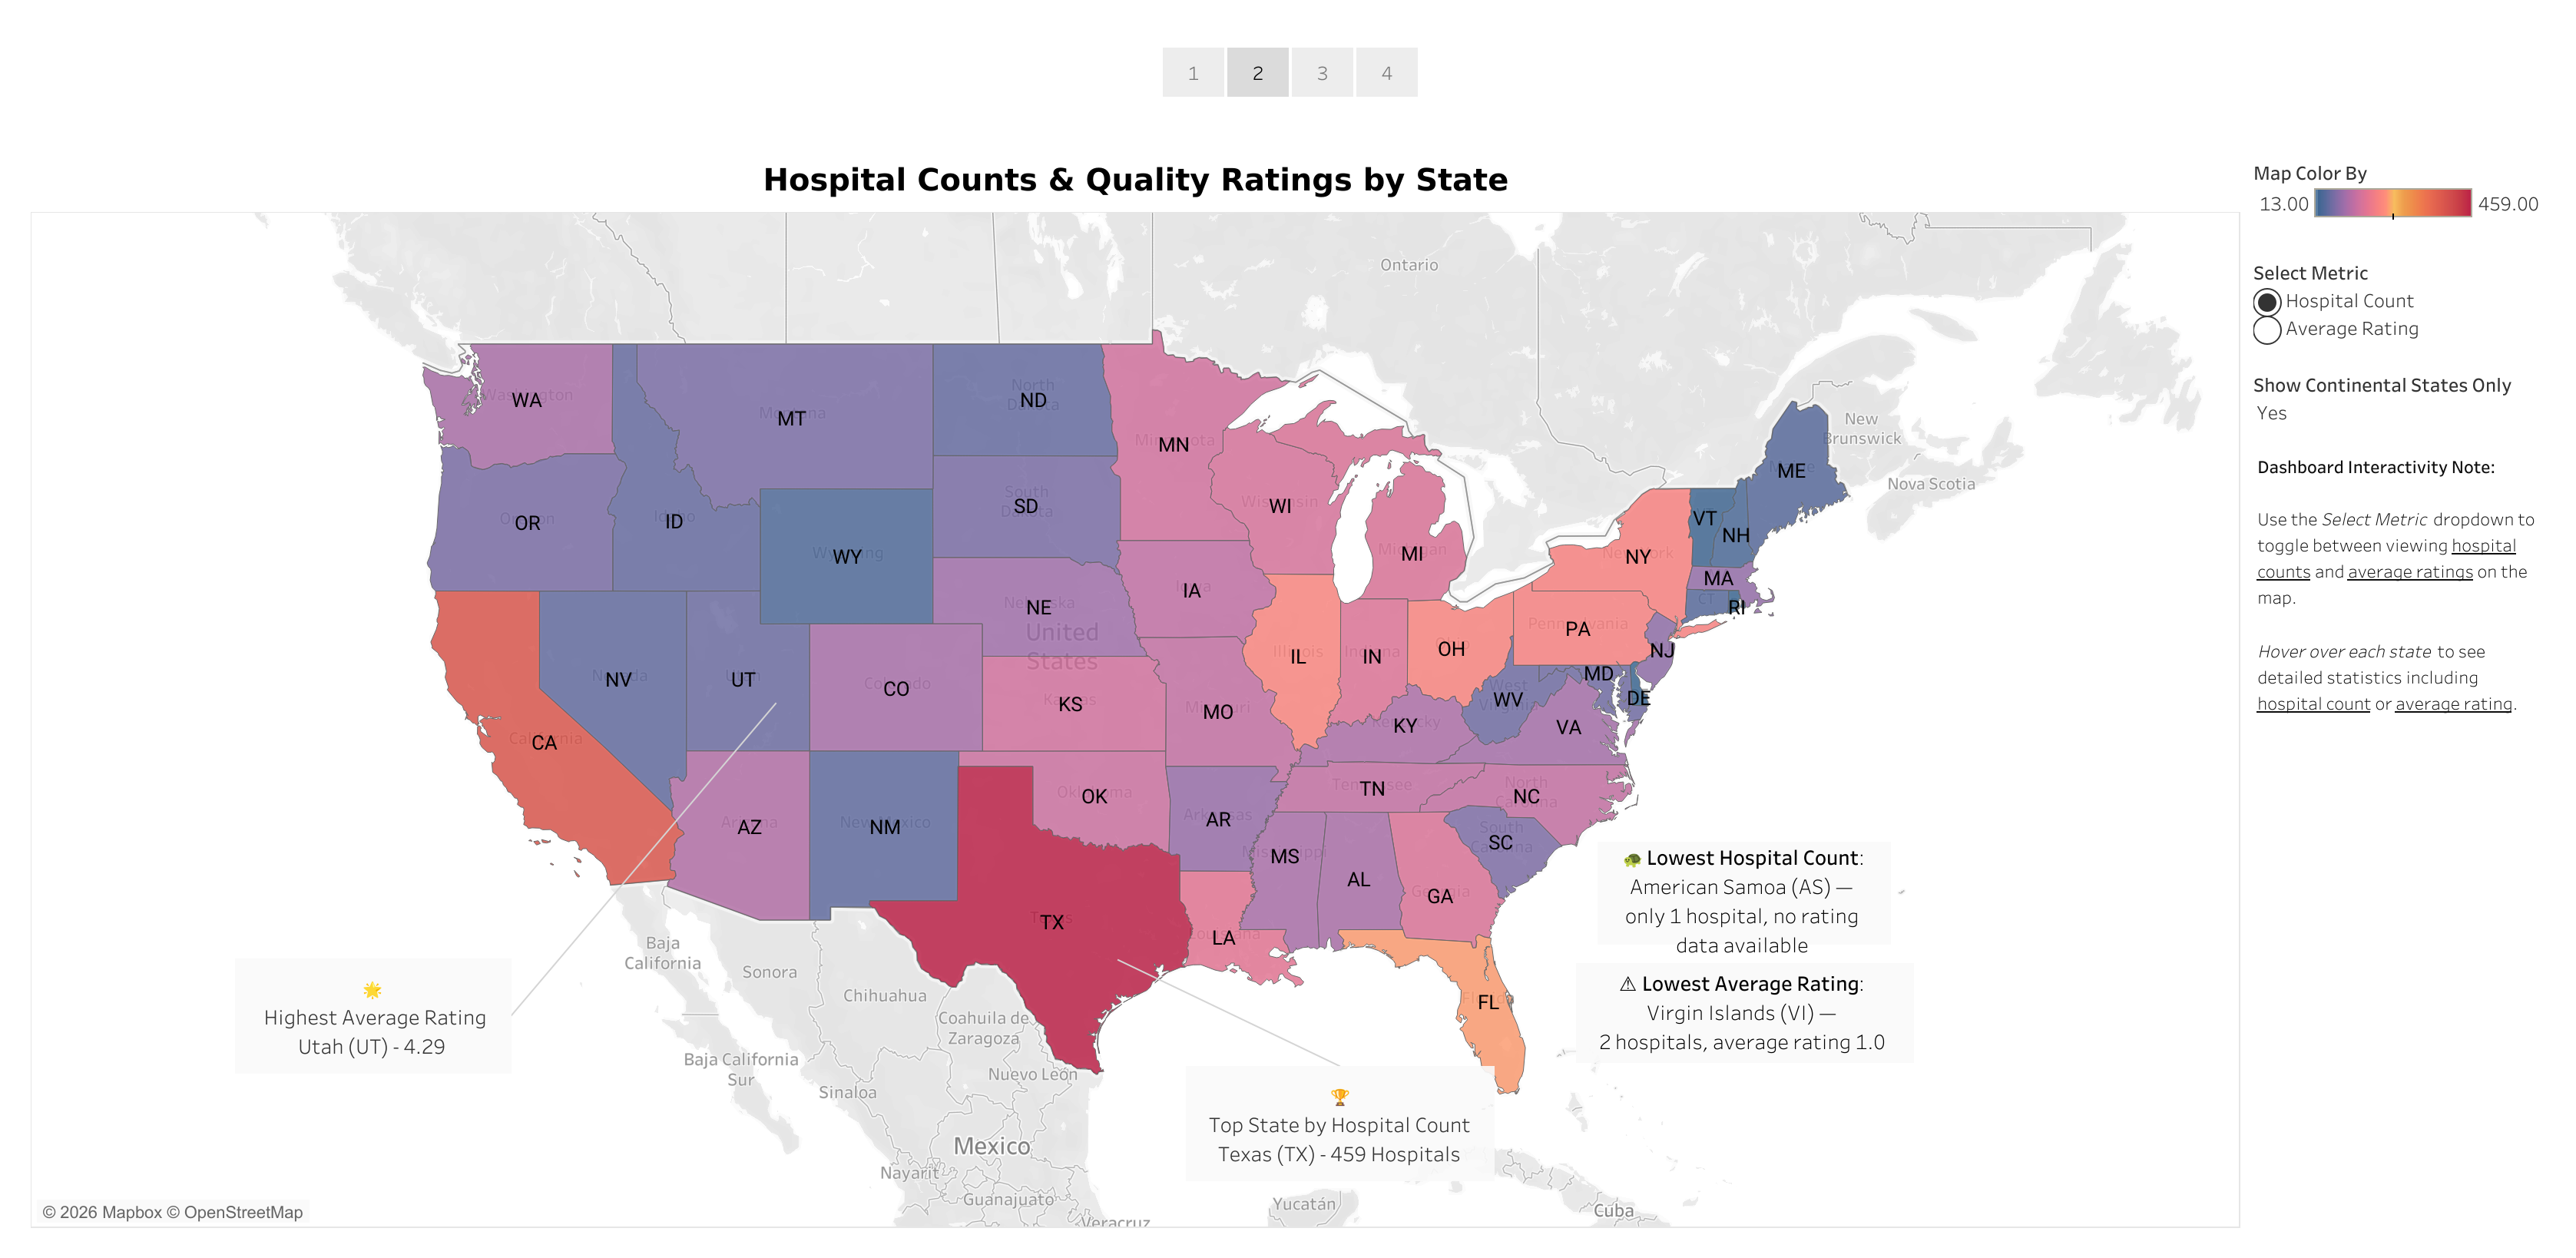
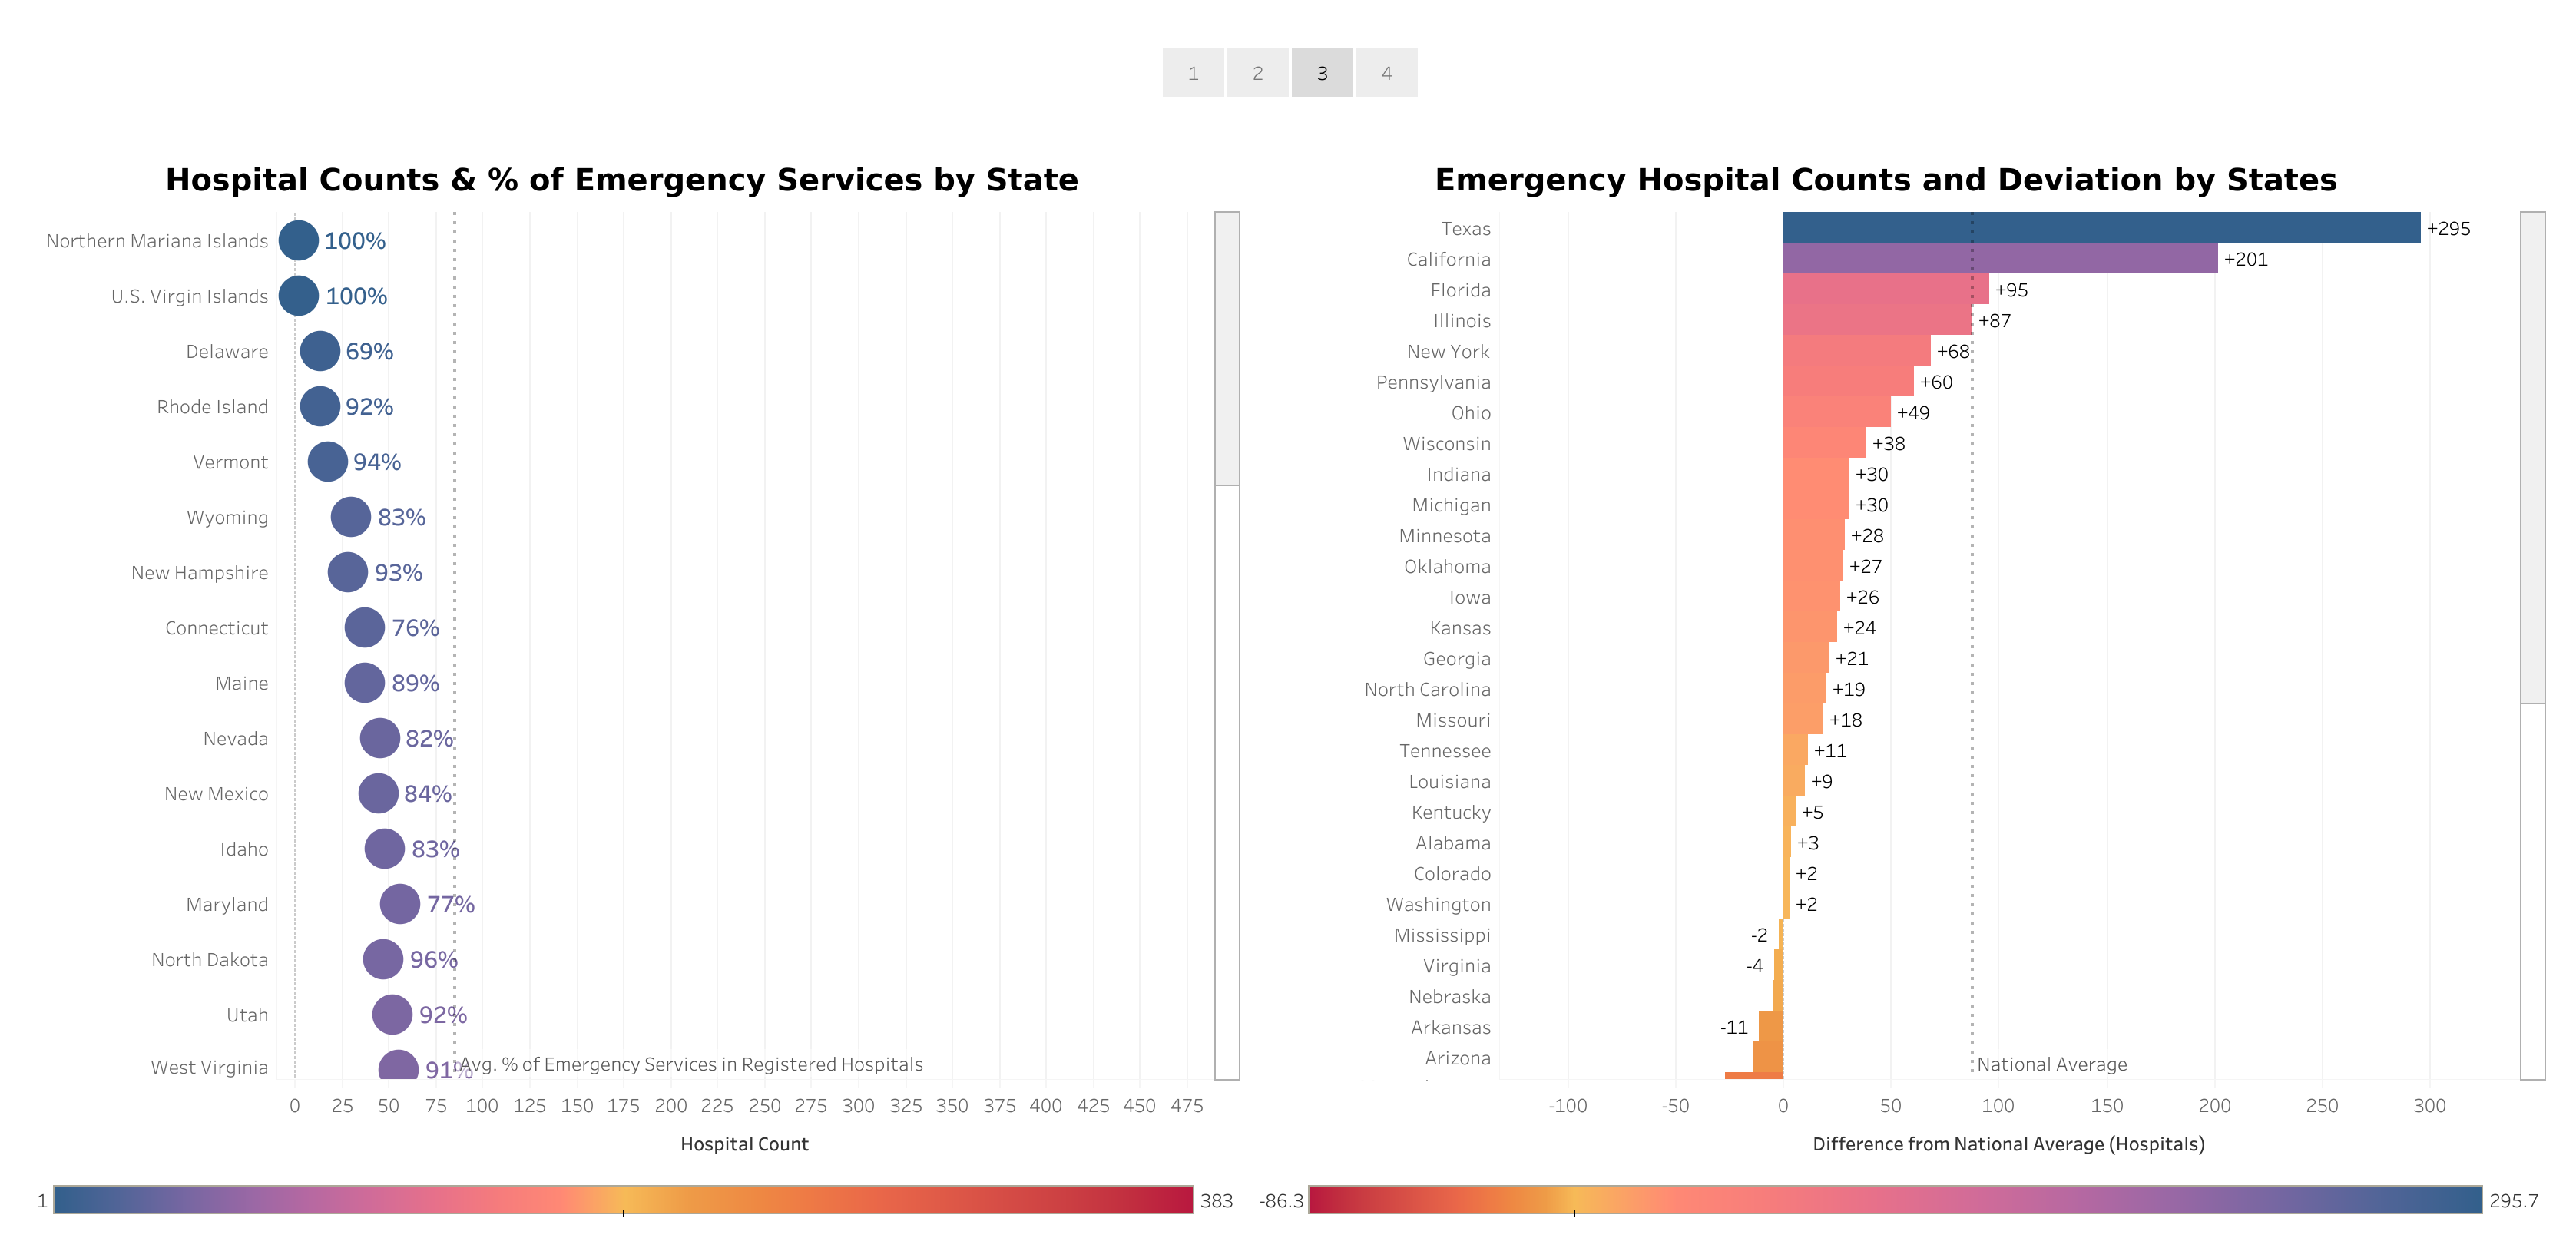
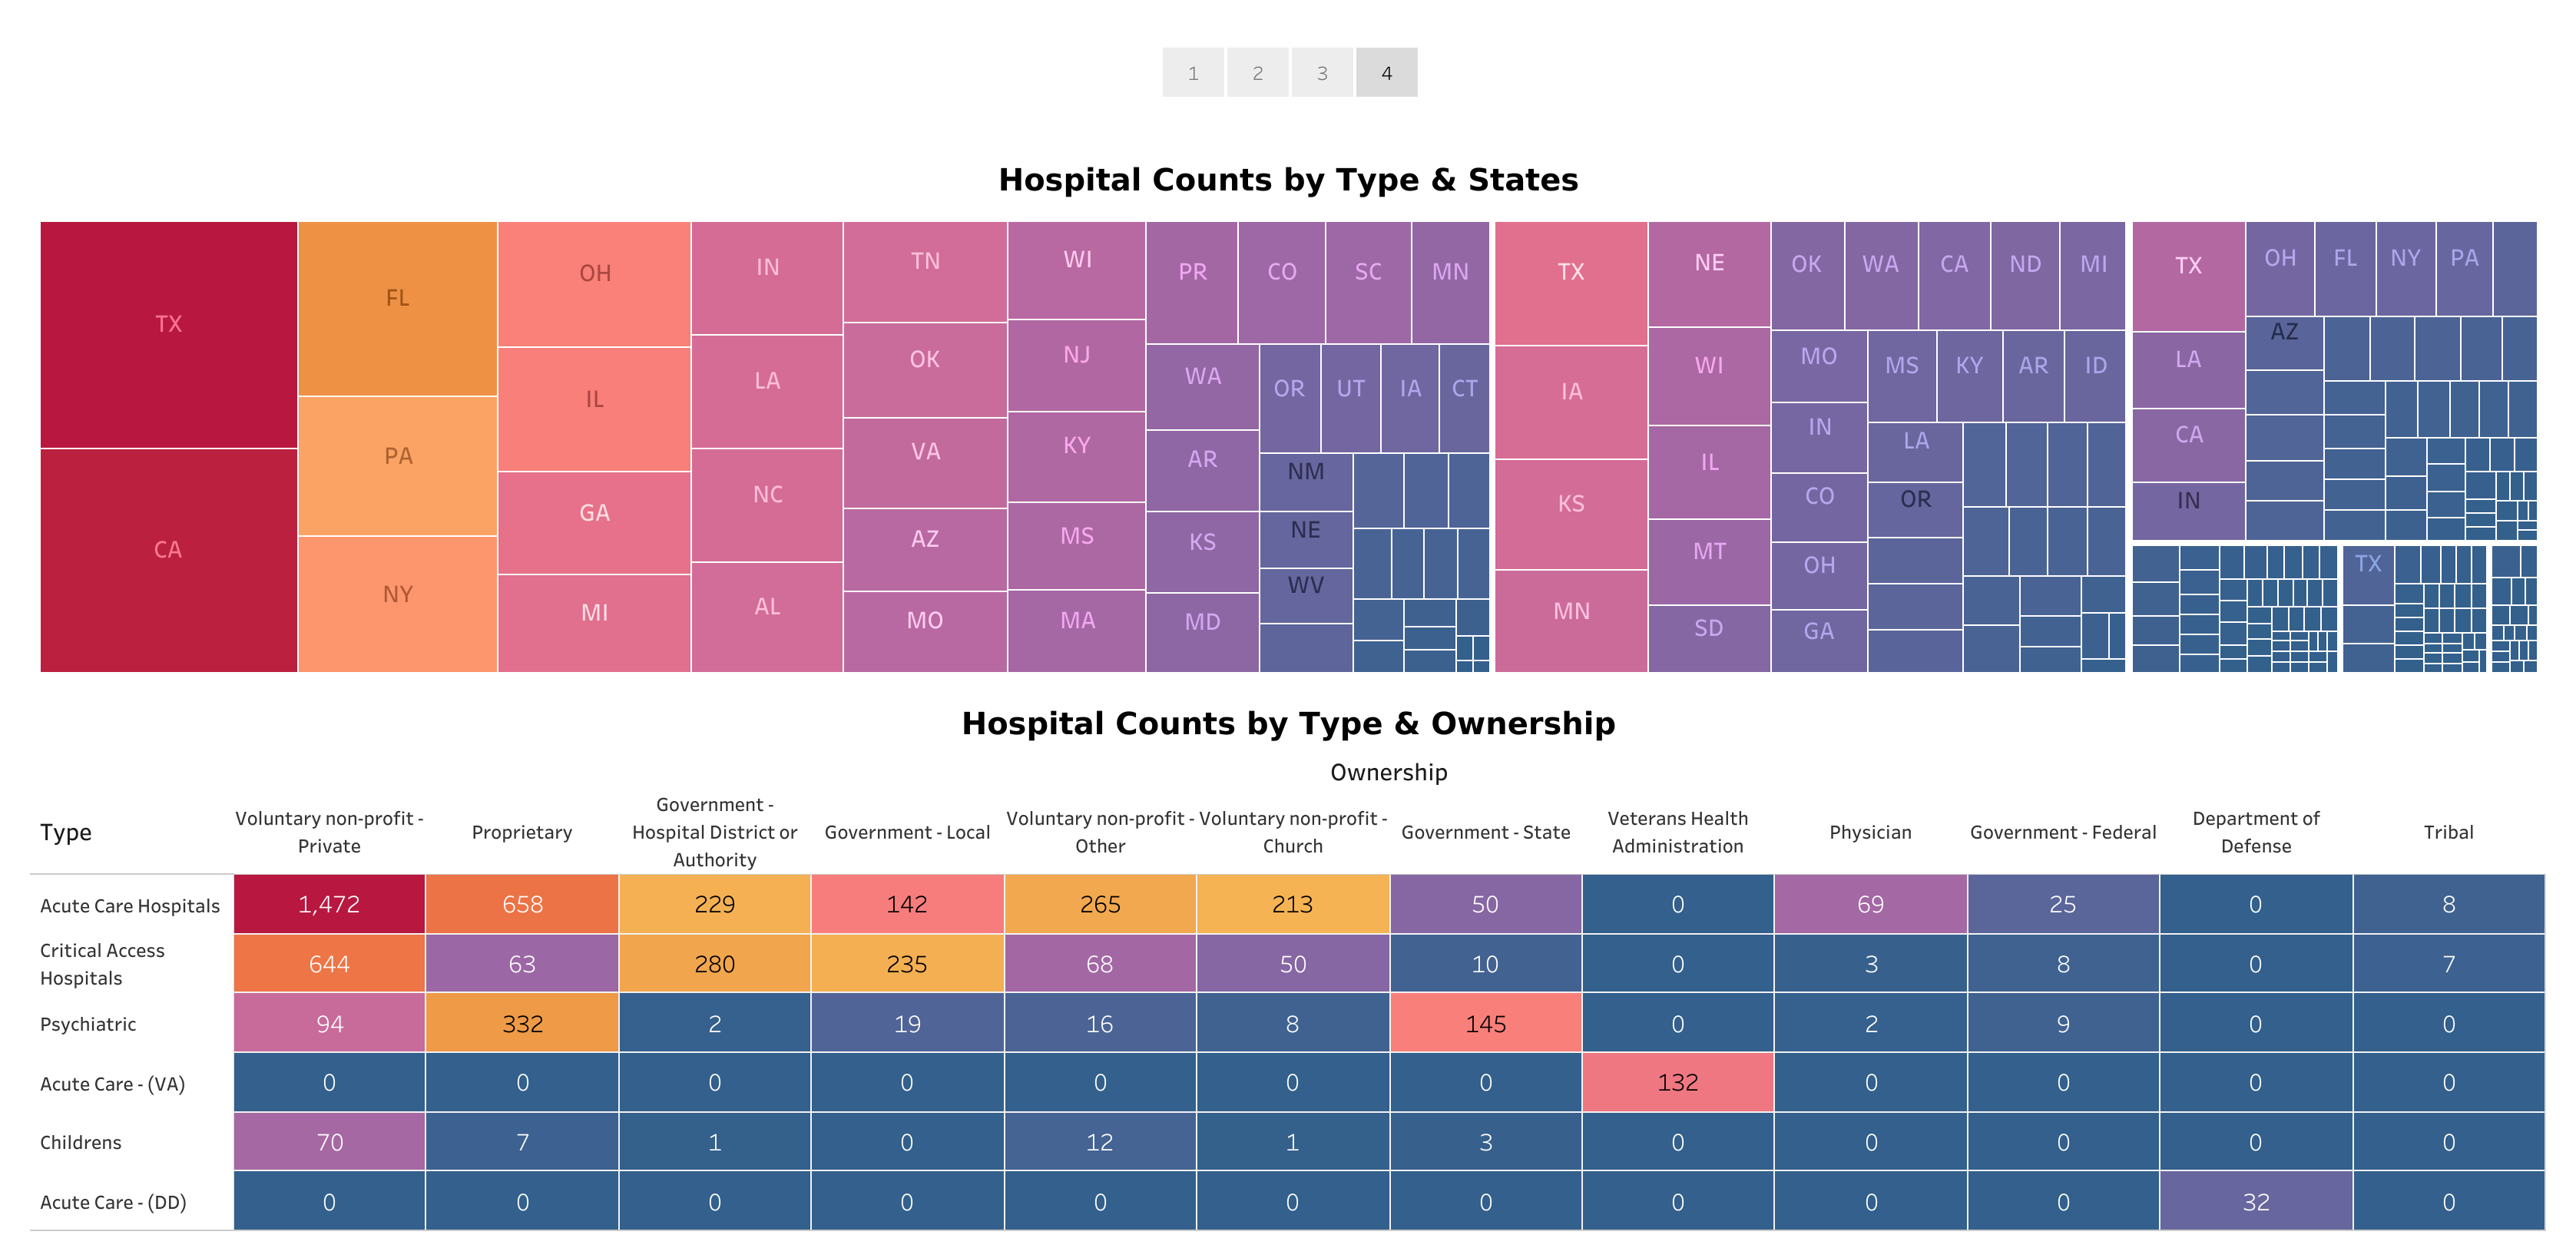
The analysis asks descriptive questions: How do hospital counts, reported emergency services, ownership types, and available quality ratings vary by state and hospital type?
This project demonstrates a complete descriptive analyst workflow: raw federal data → structured SQL questions → documented outputs → a visual story for non-technical review.
The results can help frame follow-up questions about facility distribution and reported services, but they do not by themselves identify service capacity, healthcare access, or investment priorities.
This is a descriptive analysis of a CMS dataset snapshot and does not measure causal relationships. Hospital counts do not represent bed capacity, service volume, travel distance, or population-level healthcare access.
State comparisons are not population-adjusted, percentage differences were not tested for statistical significance, and missing quality ratings can affect comparisons across states, hospital types, and ownership categories.