Interpretable Credit Risk Scoring
A proof-of-concept analysis of loan-default risk across 300K+ applications using LightGBM, SHAP explanations, threshold evaluation, and a stakeholder-facing Tableau dashboard.
The historical Home Credit Default Risk dataset is large, highly imbalanced, and suited to exploring how a classification model separates default and non-default outcomes.
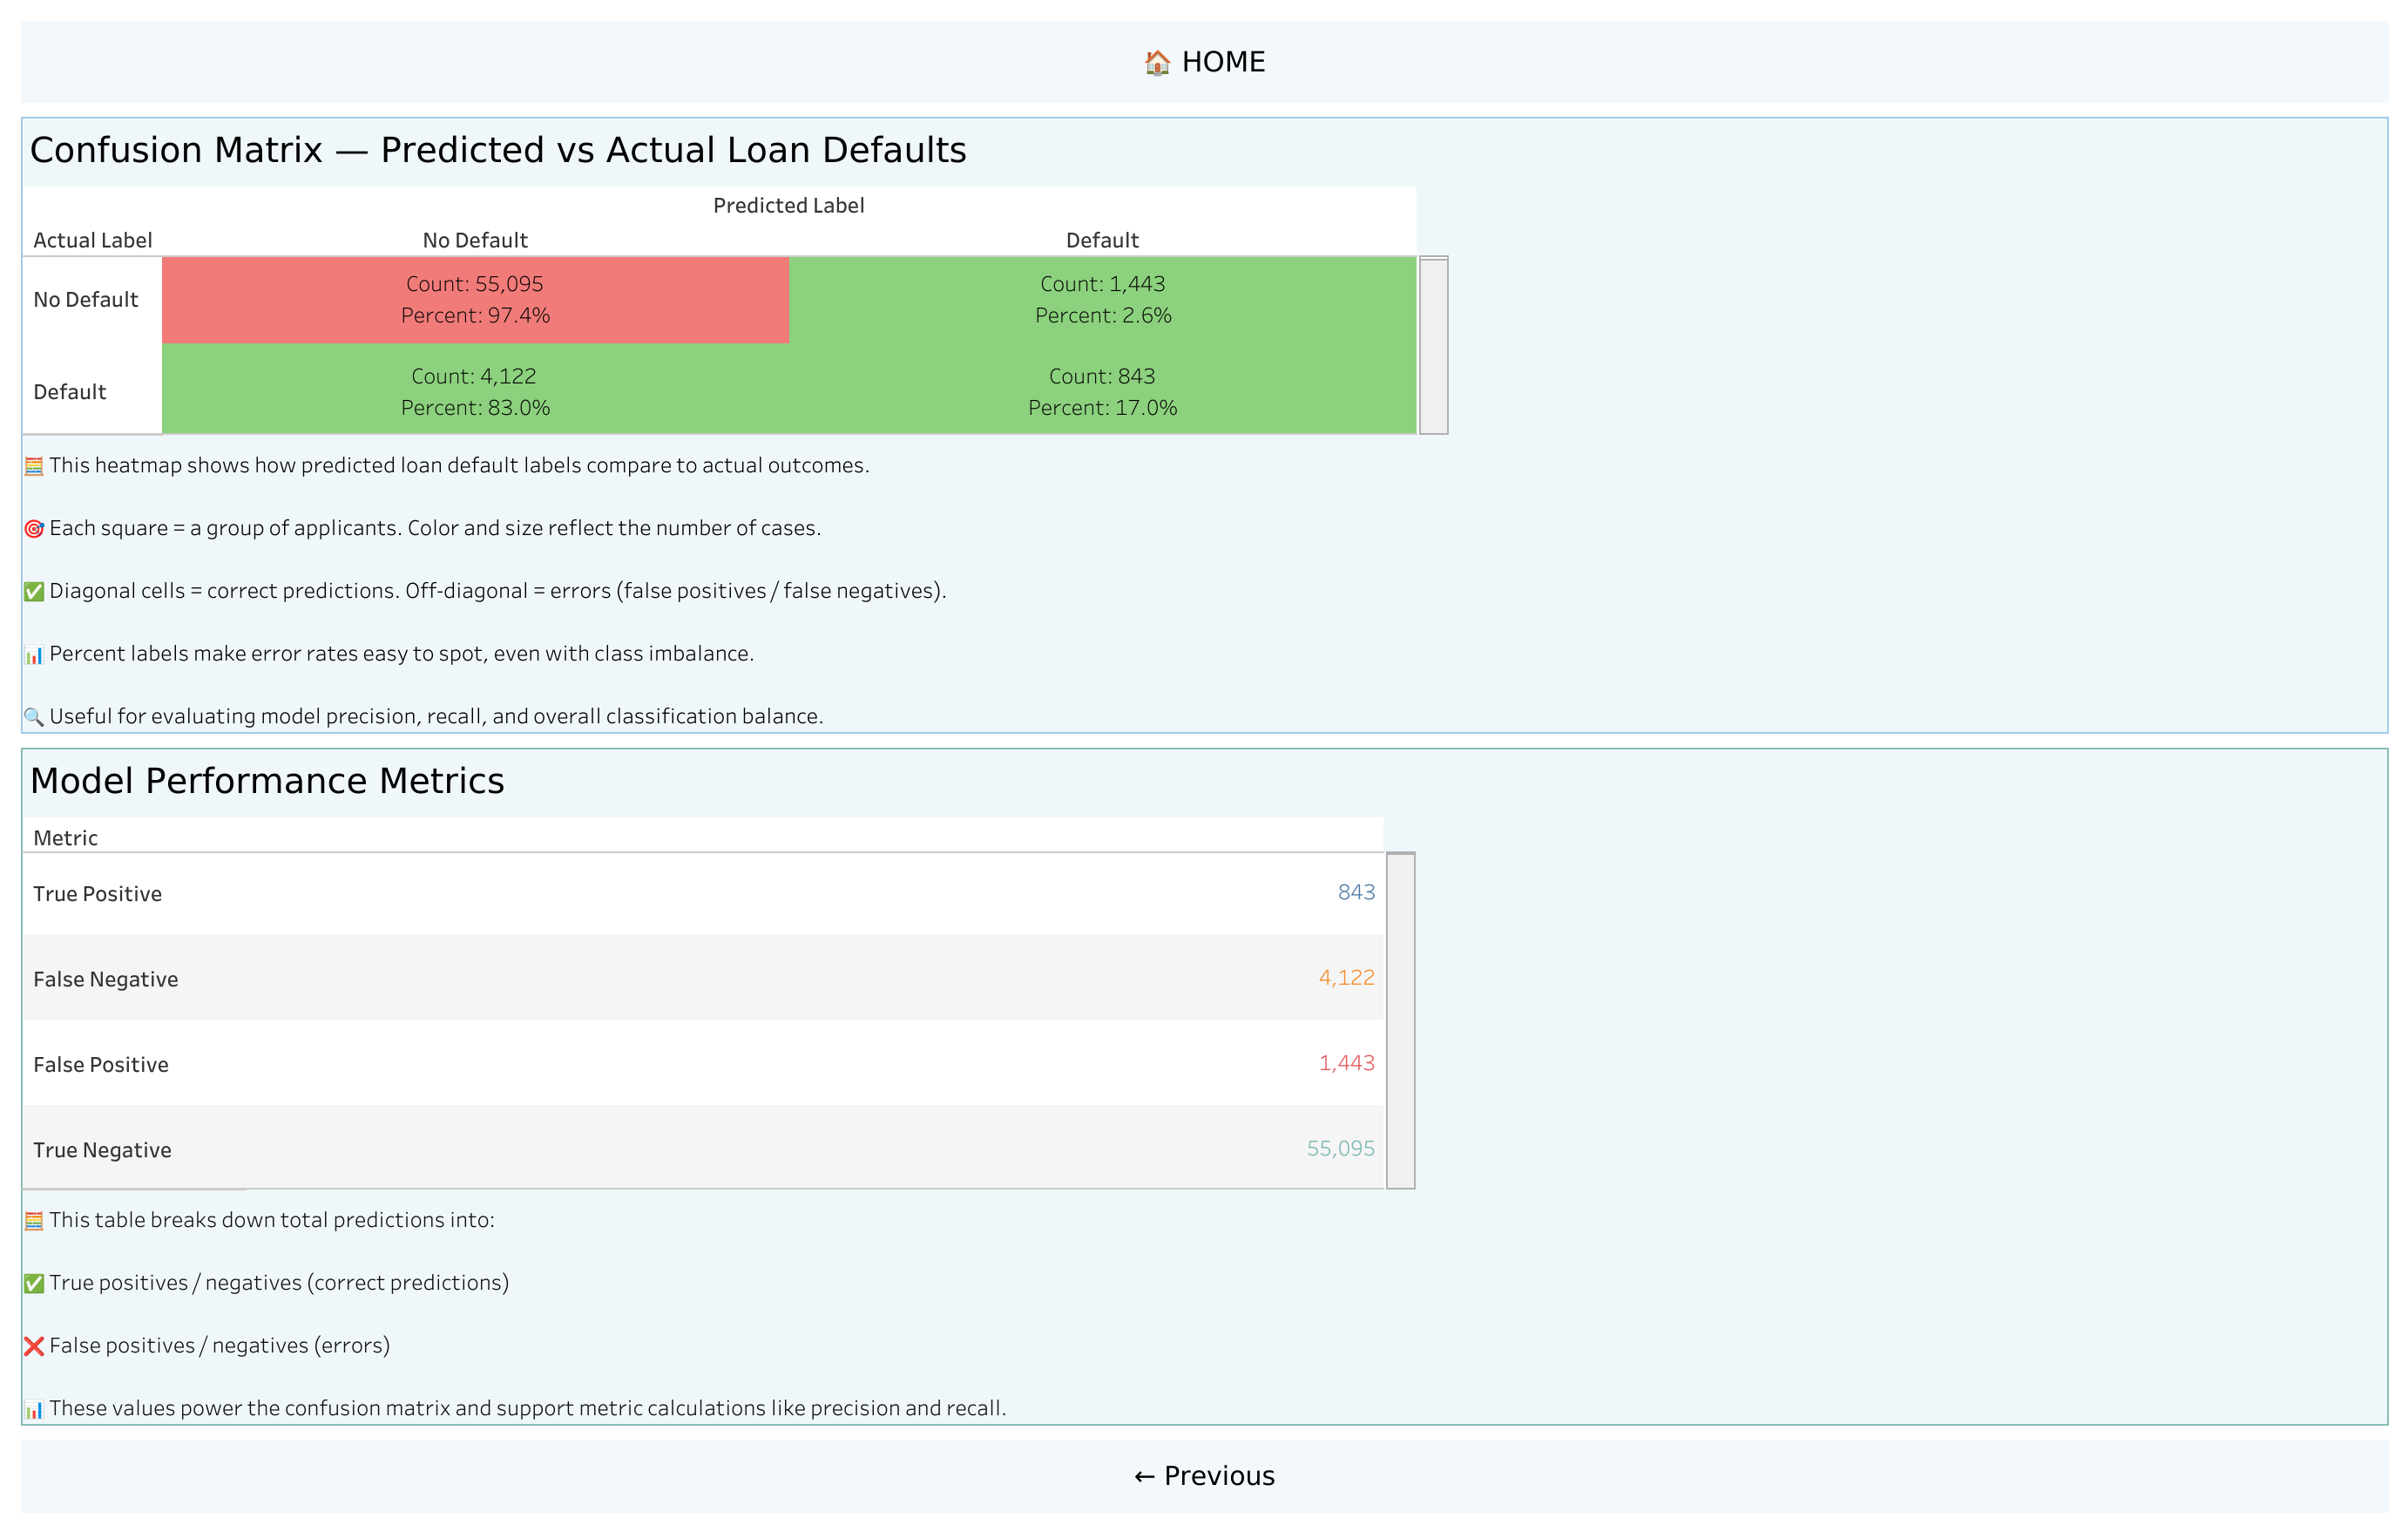
The analytical challenge was broader than ranking performance: compare precision–recall trade-offs at different decision thresholds and translate model behavior into explanations and visual outputs that non-technical reviewers could inspect.
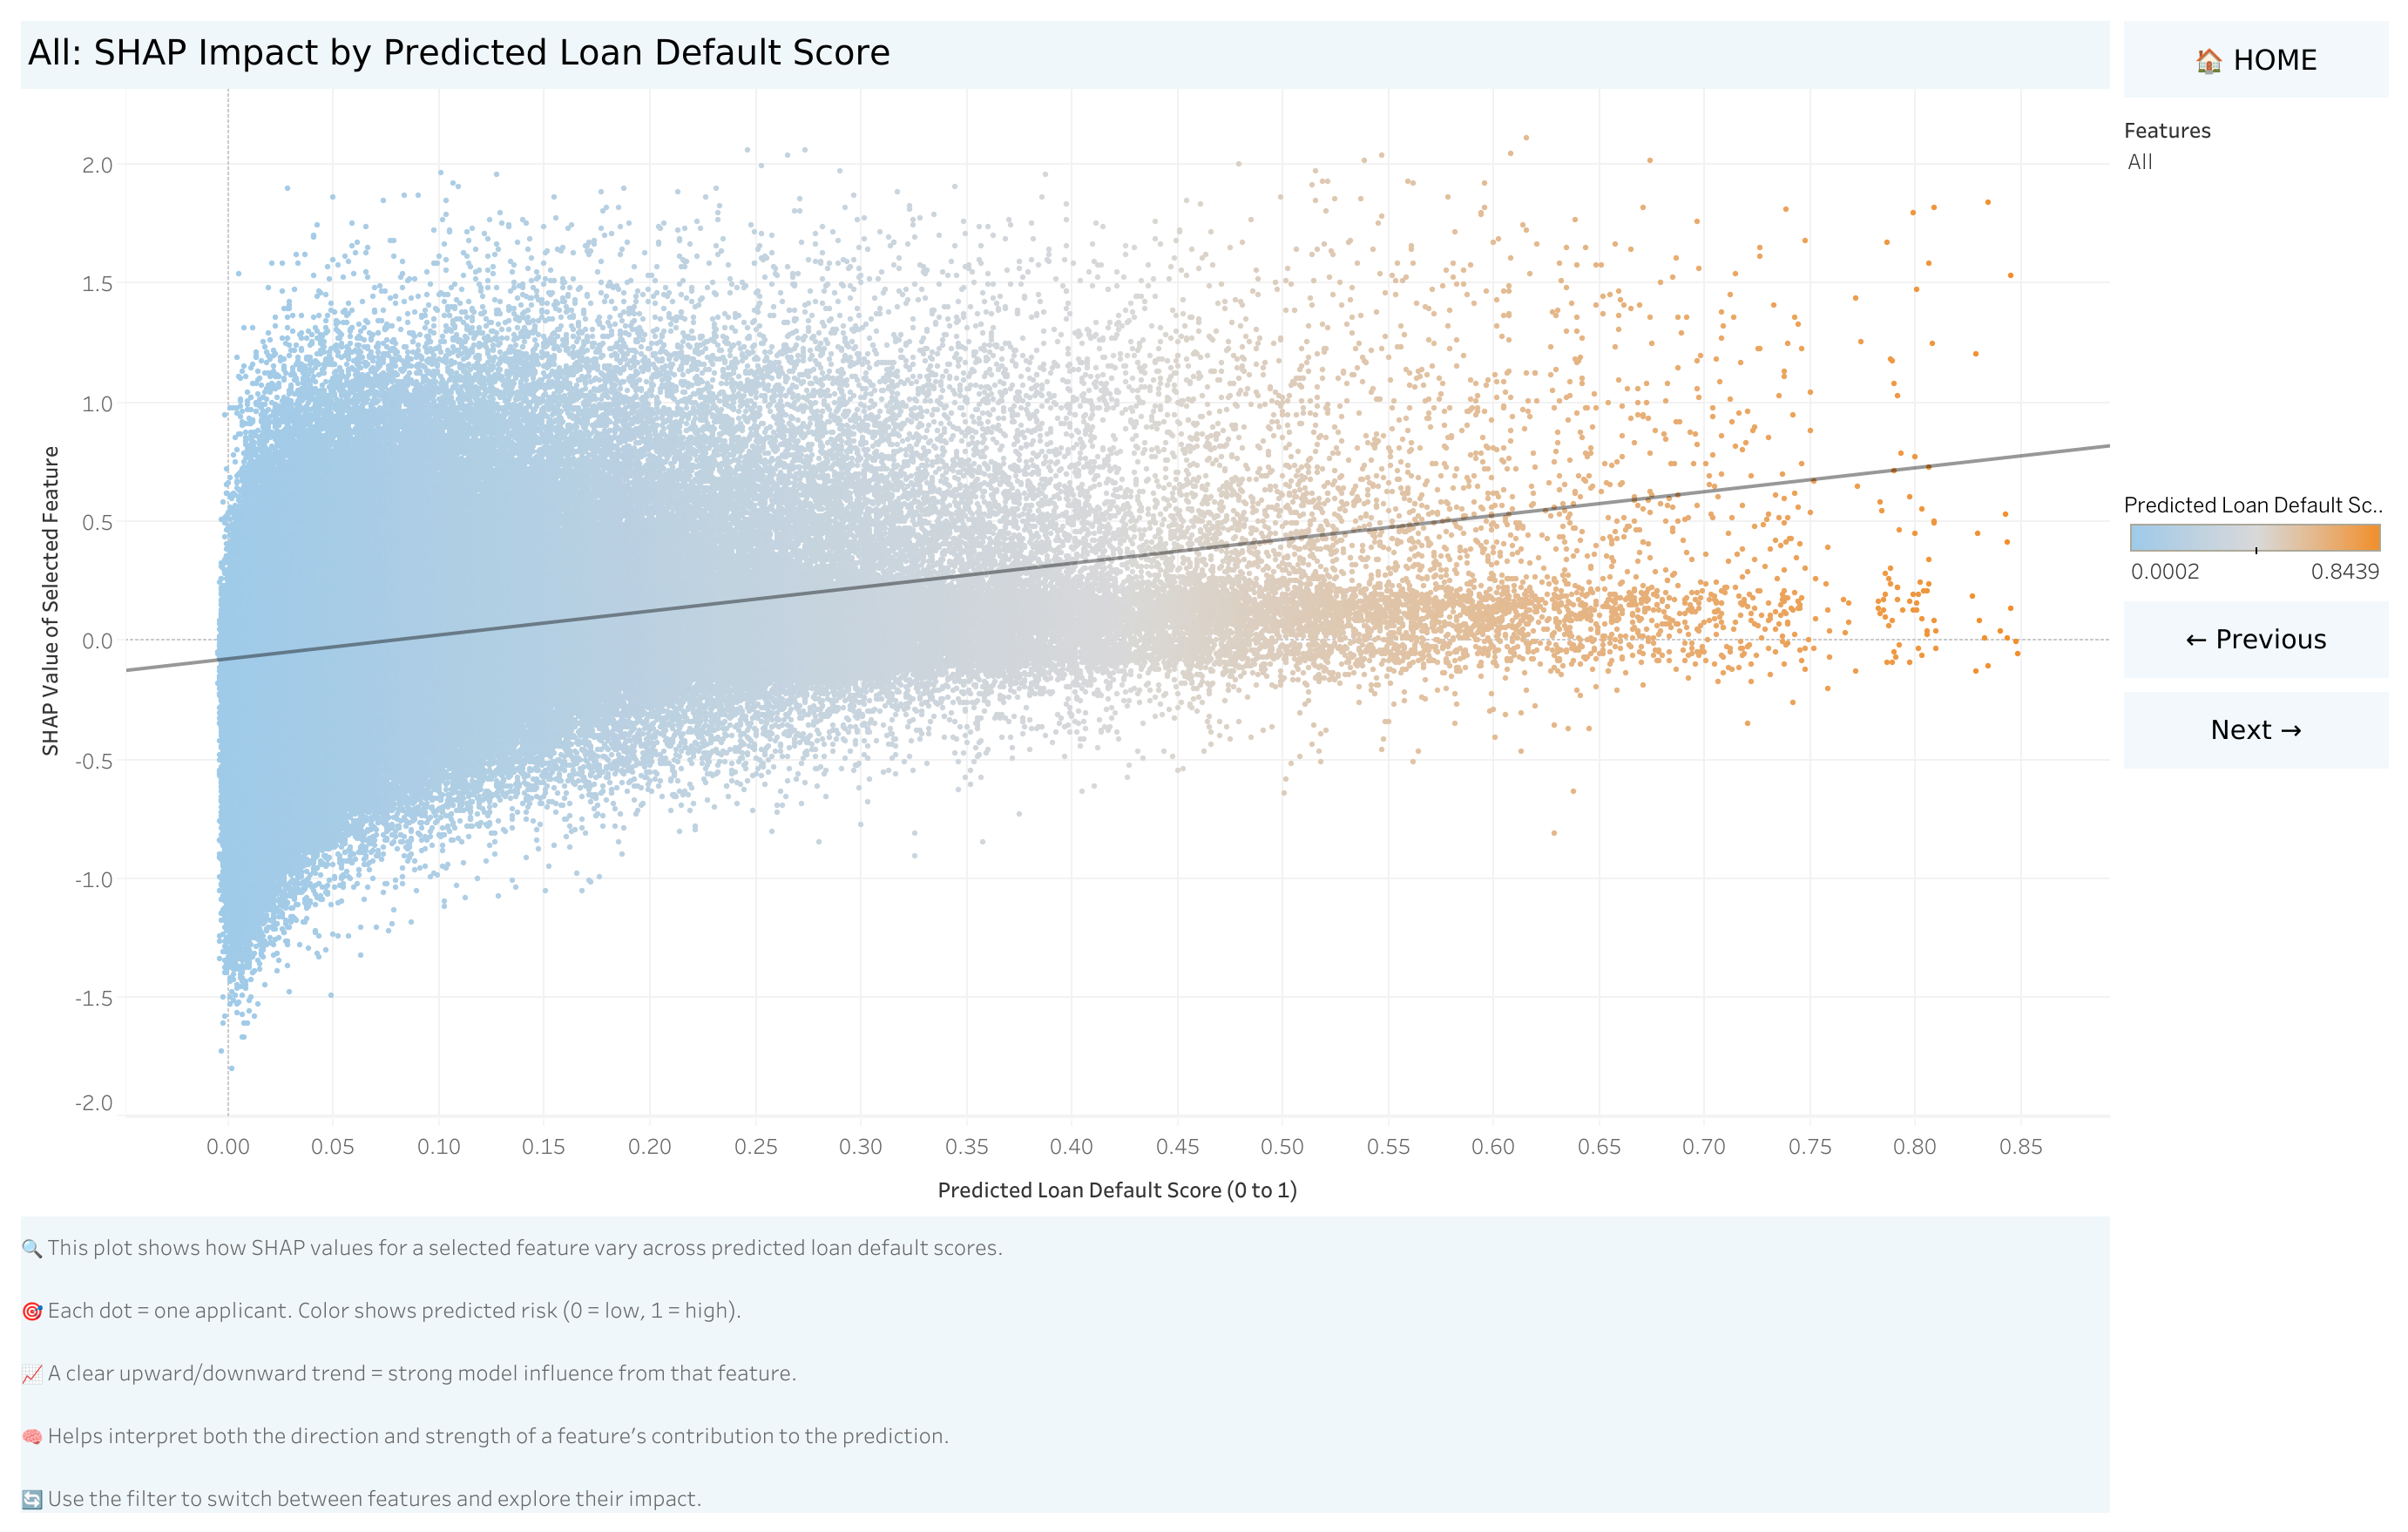
The project demonstrates how model evaluation, threshold analysis, and SHAP explanations can be combined with a dashboard to support review and discussion.
It remains a portfolio proof of concept, not a deployed underwriting system or evidence of real-lender business impact.
The dataset comes from a past Kaggle competition and may not represent a current lending population. Results depend on the selected threshold and assumed costs of false positives and false negatives.
ROC-AUC and SHAP explanations do not establish calibration, fairness, causality, or production readiness. Real lending use would require current representative data, fairness and calibration testing, governance, monitoring, human oversight, and regulatory validation.